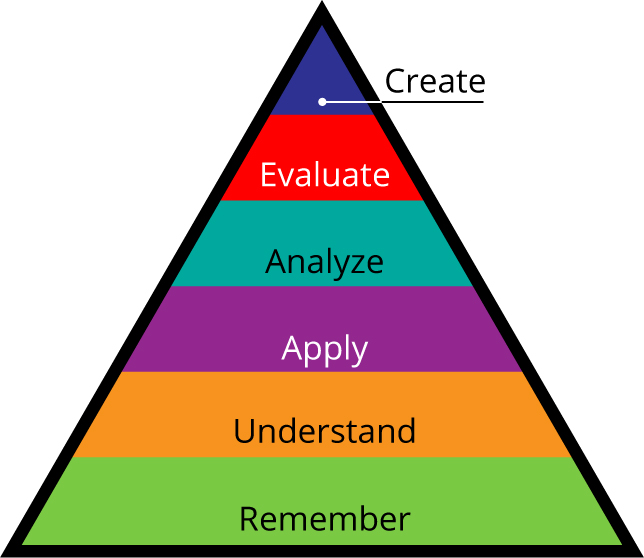

 And now we come to the final phase of the taxonomy, Creation. The learner has transferred the information so completely that they can now come up with their own ideas. They can develop or design something new following all the rules. In the terms of a course related to graphic design, the learner can now create a new layout or design utilizing the all the applications and design principles.
![]()
![]()
Adobe Illustrator is a vector-based graphics software that an artist or designer can use to create images or layouts. Typically a full layout is not created in Illustrator. Instead, it is used to create graphics and icons which are placed into other graphics. Thanks to the taxonomy, and the full knowledge of the design process, a graphic designer will have the ability to create effective pieces for any layout.
Adobe Illustrator is available as part of the Adobe Creative Cloud and can be found on the Adobe website at: Adobe.com.
![]()
![]() Adobe InDesign is the industry-leading layout and page design software for print and digital media. Complete layouts are created here utilizing all the skills learned throughout the entire taxonomy process.
Adobe InDesign is the industry-leading layout and page design software for print and digital media. Complete layouts are created here utilizing all the skills learned throughout the entire taxonomy process.
Adobe InDesign is available as part of the Adobe Creative Cloud and can be found on the Adobe website at: Adobe.com.

 Now that we understand the various concepts that makeup the course and how all the pieces relate to each other and fit together, it’s time to really put that knowledge to the test. In the context of a course about theory or law, a student might be asked to write a paper which supports or defends their decision or opinion about a particular topic. However, for a graphic design course a student would be asked to demonstrate their knowledge by creating a wireframe or mockup and sending it out for critique and review. An artist defends their understanding of design concepts by demonstrating them on the page (or screen). An instructor or fellow students judge the work and make recommendations for improving the design.
![]()
![]()
Adobe XD is a prototyping tool which is used by user experience and interaction designers to create realistic prototypes of websites, mobile apps and other types of designs. With this tool a designer can create a design which looks visually complete and even can have some, if not most, of the features of a finished design with no coding involved. With this prototyping process, a critique can identify problems which are then easily corrected before the final design is created.
Adobe XD is available as part of the Adobe Creative Cloud and can be found on the Adobe website at: Adobe.com.
![]()
![]() Survey Monkey is the industry leading survey application. Using this tool, a designer can write a series of survey questions to send accompanying their layouts to a team, manager, or potential users. These questions help the student gather information to about the success of their efforts to manipulate the form and function of the layout to match the criteria of the lesson.
Survey Monkey is the industry leading survey application. Using this tool, a designer can write a series of survey questions to send accompanying their layouts to a team, manager, or potential users. These questions help the student gather information to about the success of their efforts to manipulate the form and function of the layout to match the criteria of the lesson.
Survey Monkey can be found on their website at: SurveyMonkey.com.

 The next step is to analyze the project by deconstructing the information in to small components and examining them to gain a greater understanding of how the parts relate to one another. For a graphic design student these ideas can then be sent to fellow classmates or the instructor for some collaborative critiques.
![]()

Adobe Acrobat is a program used to create, edit, and share Portable Document Format (PDF) files. This type of file is highly versatile and can be opened by pretty much every desktop and mobile device in existence. It is the perfect tool for collecting and organizing ideas related to graphic design in both a professional setting and in the classroom. It allows creators to share their files for review through the cloud and anyone invited can leave comments (which resemble sticky notes) directly on the file. It is also possible to create completely 508 compliant PDFs which is essential when there is a requirement for deliverables to be accessible to persons with disabilities.
There are multiple version of Acrobat. The free reader version is likely already on all your devices. The Pro version comes included with an Adobe Create Cloud account and can be found on the Adobe website at: Adobe.com.
![]()
![]() Slack is an industry leading communications platform. Users create and respond to channels (or threads of conversations) related to individual topics or projects. For use with graphic design these channels are perfect for teams to talk about, critique, and improve concepts and projects. These conversations can help a student to pull the project or ideas apart so they can gain the full understanding of the overall idea or design. While Slack is great for the analyzing step, its usefulness extends across all aspects of most projects from beginning to end. I highly recommend using it for all your collaborative projects in the classroom and out.
Slack is an industry leading communications platform. Users create and respond to channels (or threads of conversations) related to individual topics or projects. For use with graphic design these channels are perfect for teams to talk about, critique, and improve concepts and projects. These conversations can help a student to pull the project or ideas apart so they can gain the full understanding of the overall idea or design. While Slack is great for the analyzing step, its usefulness extends across all aspects of most projects from beginning to end. I highly recommend using it for all your collaborative projects in the classroom and out.
Slack can be found in any app store and on their website at: Slack.com.

 Now that the learner understands the topic completely, they now are asked to use that information in new situations. They can sufficiently demonstrate the knowledge and implement concepts in ways they never had before. For a graphic design course, students can use tools to create visualizations of the initial layout ideas or mind map the overall ideas for the project or concept that is being taught.
![]()
![]()
Procreate is a drawing application exclusively for iPad. This provides the most realistic drawing experience on a mobile device. Using this a Graphic Designer student can sketch out or illustrate their understanding of the concepts they are learning or even a rough wireframe of a class project. These images can then easily be shared with the instructor or other students in the class.
You can find Procreate in the iOS app store or at their website: Procreate.art.
![]()
![]() MindNode is a cloud based visual brainstorming application allowing users to create mind maps. These are a form of non-linear graphical diagrams made of a series of connected tasks, words, concepts or ideas representing or projects. A mind map helps organize and visualize a long lists of information into colorful, regular, and easy-to-remember diagrams. For graphic design students these are perfect for exploring concepts and requirements for assignments and design projects.
MindNode is a cloud based visual brainstorming application allowing users to create mind maps. These are a form of non-linear graphical diagrams made of a series of connected tasks, words, concepts or ideas representing or projects. A mind map helps organize and visualize a long lists of information into colorful, regular, and easy-to-remember diagrams. For graphic design students these are perfect for exploring concepts and requirements for assignments and design projects.
You can find MindNode at their website: MindNode.com.

 Next, the learner must then be able to explain those ideas to someone else. To master this level of the Bloom’s pyramid they must demonstrate understanding the topic by recognizing, describing, and explaining its concepts other people. To accomplish this, a learner might be asked to write a paper, give a presentation, or lead a group of classmates in populating a digital whiteboard. To help the learner(s), an instructor might assign the following two applications (neither of which is exclusive to a graphic design course):
![]()
![]()
Google Jamboard is a cloud based, digital whiteboard where users can collaborate in real time to sketch, draw, and write anything. The system works directly with Google so topics can be searched and annotated on the whiteboard. In the case of a graphic design class, a student could use a Jamboard to illustrate or diagram concepts like the design process or the fundamentals of design.
Jamboards come free with a Google account and can be found at: Jamboard.google.com.
![]()
![]() Google Docs is a cloud based word processing application where users can write and share anything. It is a highly versatile application with many review, commenting, styling, and sharing capabilities. The system works directly with Google so topics can be searched and annotated directly on the page. This application is highly useful for any classroom setting.
Google Docs is a cloud based word processing application where users can write and share anything. It is a highly versatile application with many review, commenting, styling, and sharing capabilities. The system works directly with Google so topics can be searched and annotated directly on the page. This application is highly useful for any classroom setting.
Google Docs comes free with a Google account and can be found at: Docs.google.com.

 The first level of the Bloom’s pyramid focuses of teaching the learner the memorize and recall basic facts and concepts related to the topic. Before moving to the next level, a learner must recognize and recall the these facts and concepts. For a course related to graphic design a learner might be required to master concepts related to layout, composition, color, typography, and applications like Adobe Photoshop. To help the learner(s), an instructor might assign the following two applications (neither of which is exclusive to a graphic design course):
![]()
![]()
Quizlet is a digital flashcard application with thousands of pre-built sets of flashcards covering many different subject and all levels of education. Learners utilize these flashcards after initial instruction to reinforce knowledge and cement memorization.
Quizlet can be found at: Quizlet.com.
![]()
![]() Evernote is a note taking application which allows a user to write and organize information. Learners utilize it to enter their course notes, then quickly sort and retrieve them later while studying. A learner also can turn your notes directly into tasks, which helps keep course work on track. This application can (and should0 be used continuously throughout a course for note taking and task management.
Evernote is a note taking application which allows a user to write and organize information. Learners utilize it to enter their course notes, then quickly sort and retrieve them later while studying. A learner also can turn your notes directly into tasks, which helps keep course work on track. This application can (and should0 be used continuously throughout a course for note taking and task management.
Evernote can be found at: Evernote.com.